Back
20 Jan 2020
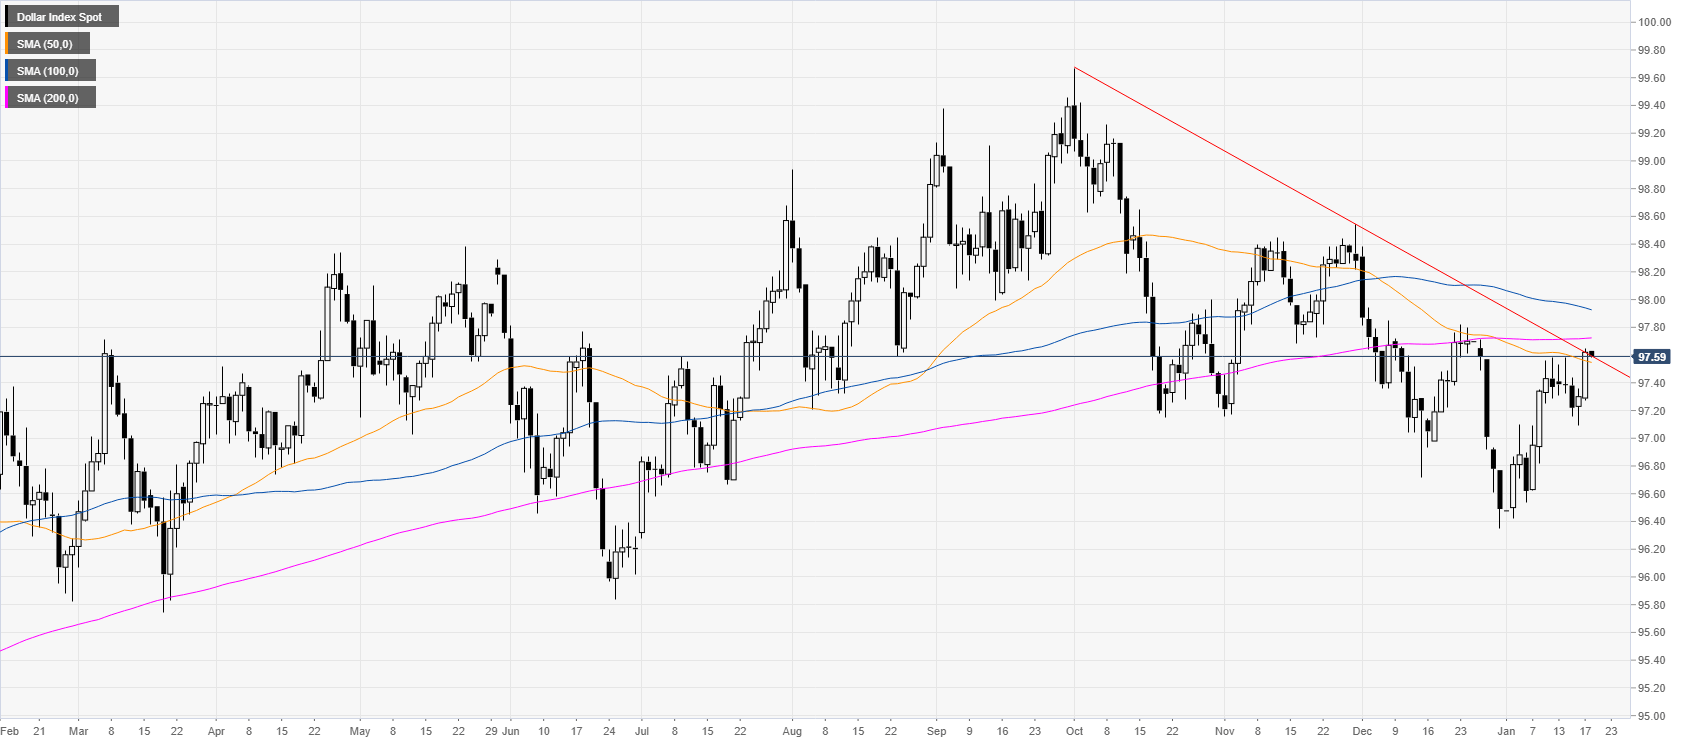
US Dollar Index London Price Forecast: DXY kicking off the week near January highs
- DXY is starting the new week near the January highs.
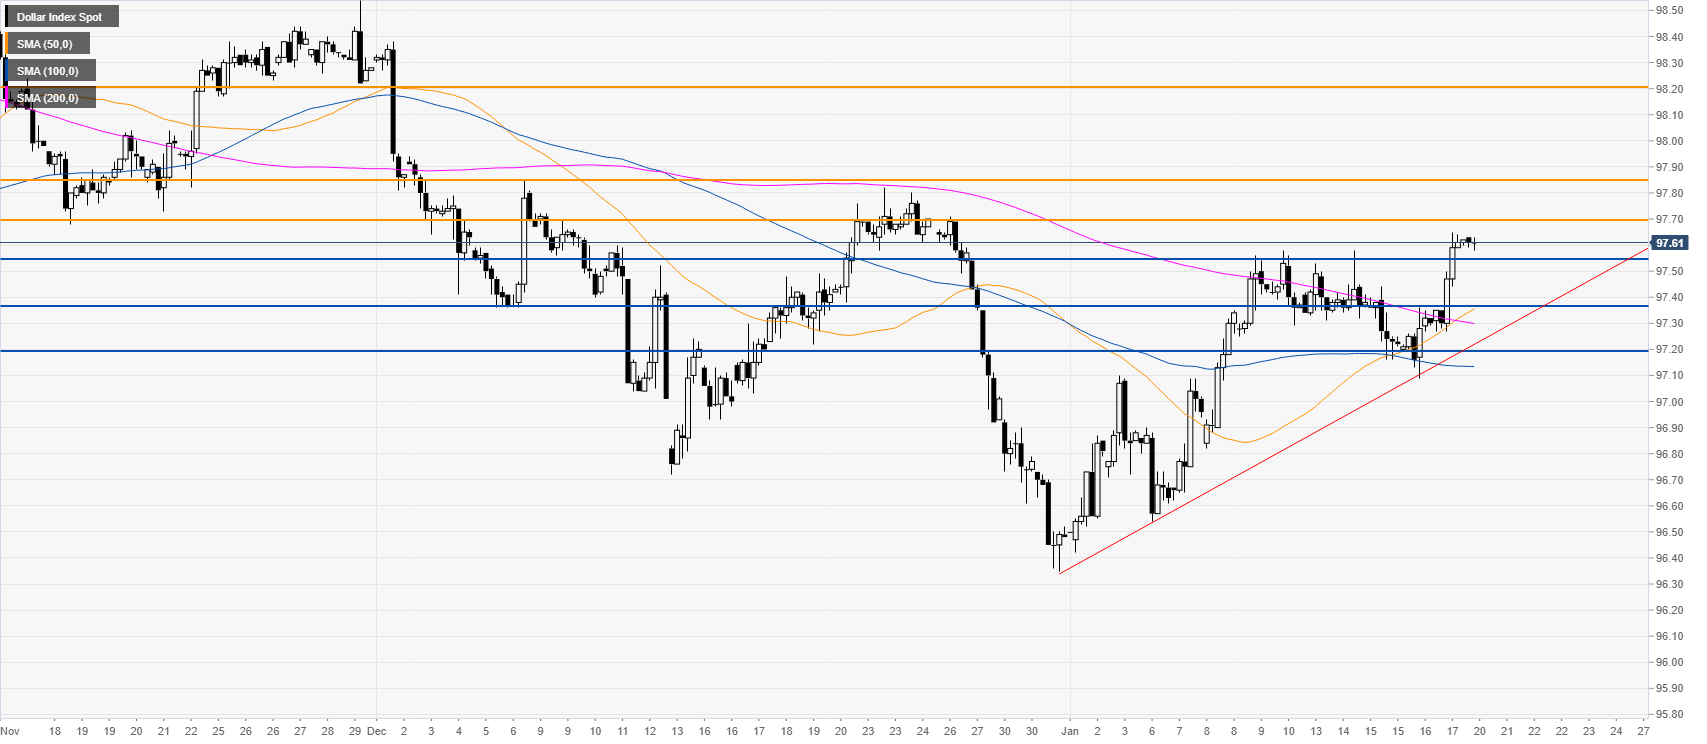
- Resistance is at 97.70 while support is seen at the 97.55.
- A break below 97.55 can lead to a deeper pullback down.
DXY daily chart
The US Dollar Index (DXY) is trading near the January highs while challenging a descending trendline originating from October 2019.
DXY four-hour chart
DXY is trading above the main simple moving averages (SMAs) and a rising trendline, suggesting a bullish bias. Bulls will need a break above the 97.70 resistance to travel towards 97.85 and to a larger breakout to 98.20. However, the market might enter a consolidation first with a potential pullback down below the 97.55 level. Support is seen at the 97.35 and 97.20 levels.
Additional key levels