Back
4 Feb 2020
GBP/USD Price Analysis: Pound bounces from lows, challenges 1.3036 resistance
- GBP/USD is rebounding from the lower end of its range.
- The level to beat for bulls is the 1.3036 resistance.
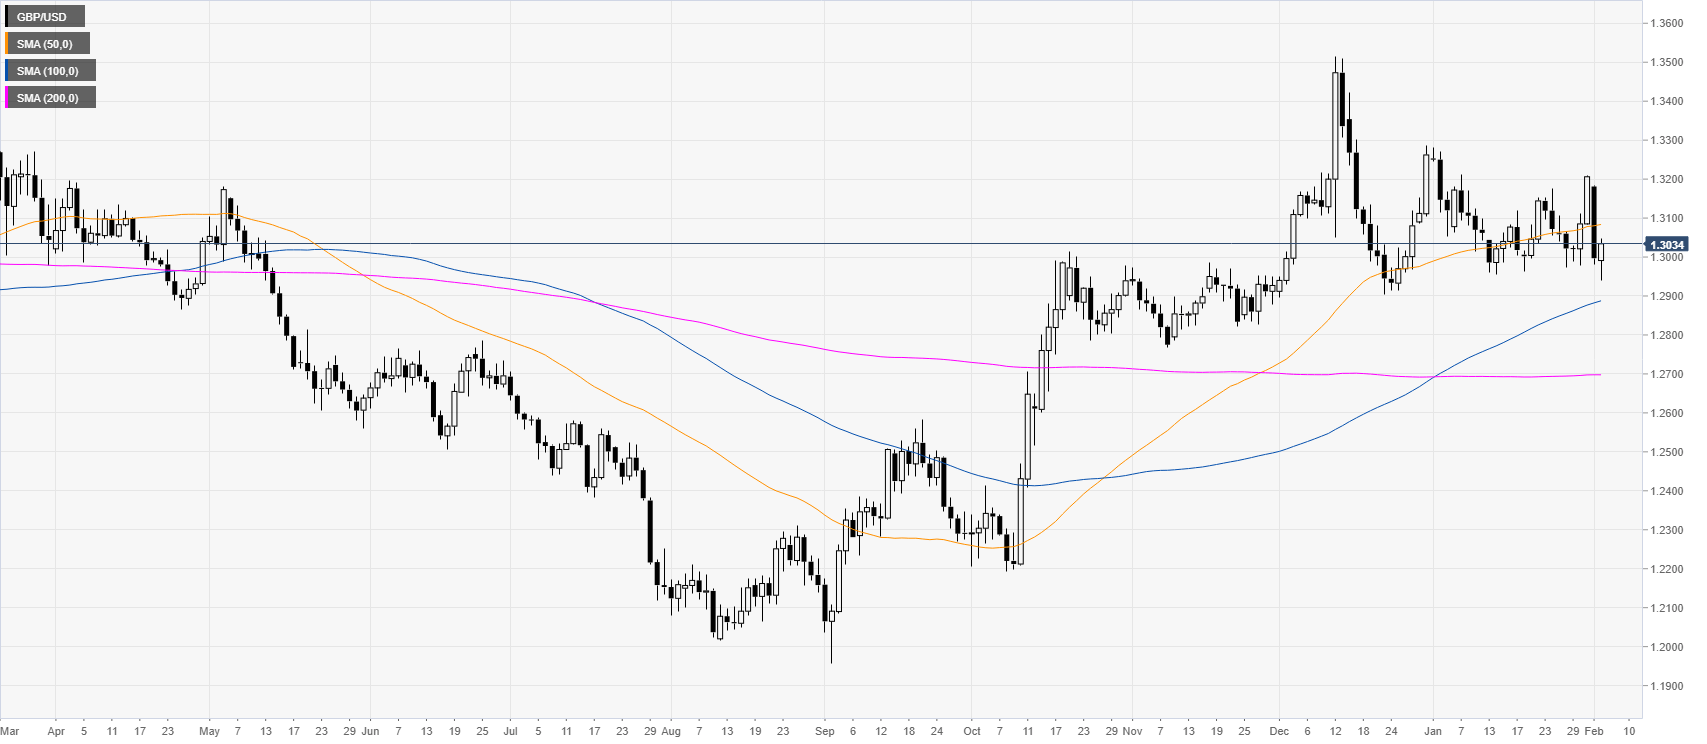
GBP/USD daily chart
After the October and December bull-run, the market is trading in a rectangle consolidation above the 100/200-day simple moving averages (SMAs).
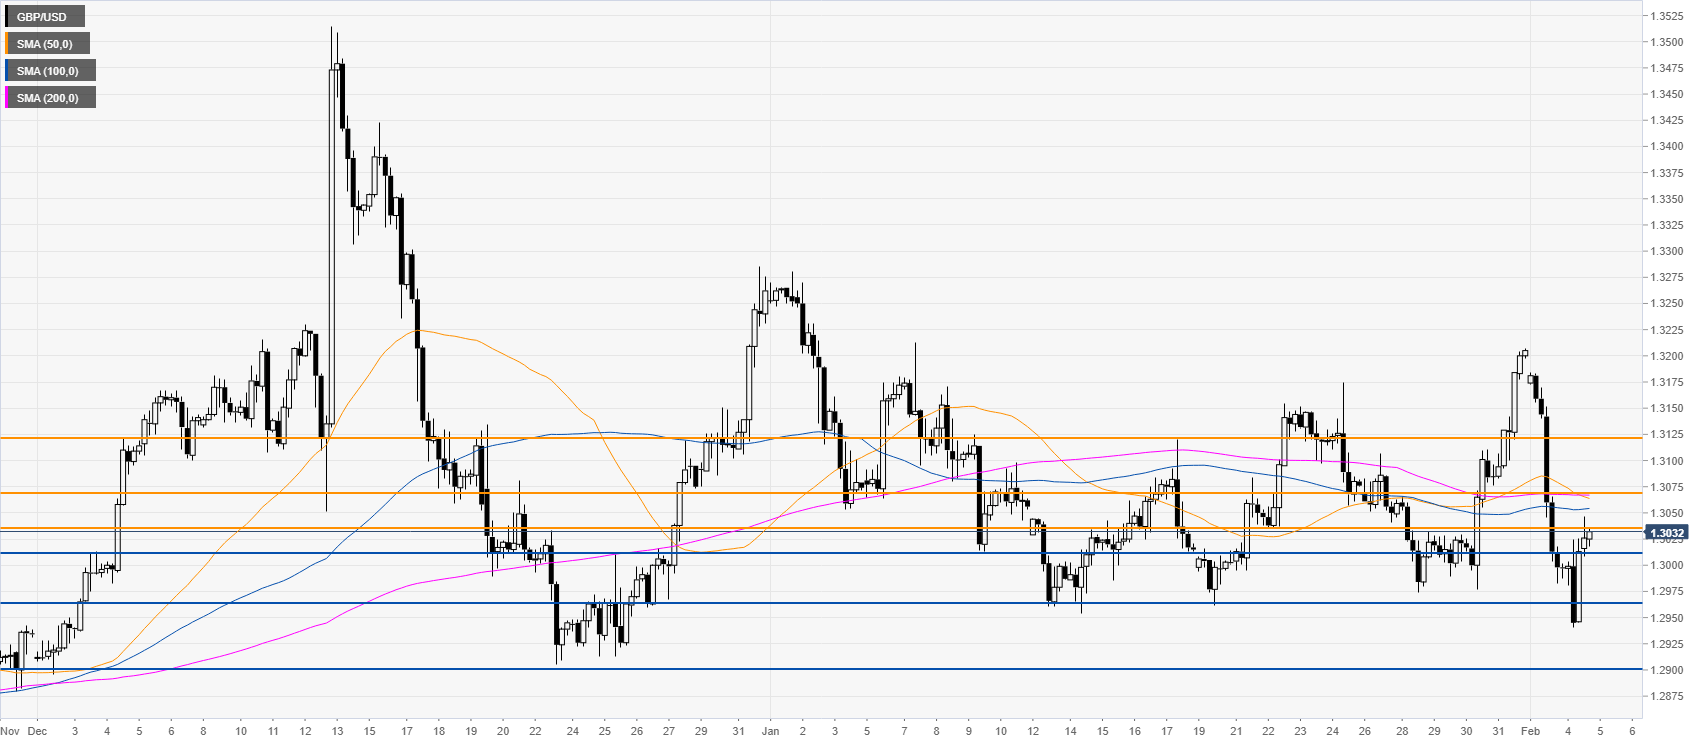
GBP/USD four-hour chart
The pound is rebounding from the lower end of its range as the spot is challenging 1.3036 resistance. Bulls want to reach the 1.3070 and 1.3120 levels, according to the Technical Confluences Indicator. Support is seen at the 1.3010, 1.2967 and 1.2900 levels.
Resistance: 1.3036, 1.3070, 1.3120
Support: 1.3010, 1.2967, 1.2900
Additional key levels