EUR/USD tumbles to new 2020 lows near 1.0850
- EUR/USD loses further ground and tests 1.0850, fresh YTD lows.
- Risk aversion resurged in the global markets and lifted the dollar.
- US inflation measured by the CPI next of relevance in the calendar.
The European currency is now coming under renewed selling pressure and drags EUR/USD to the area of new 2020 lows near 1.0850.
EUR/USD weaker ahead of US data
There is no respite for the decline in the pair, which has now lost ground in eight out of the last nine sessions and returned to levels last seen in April 2017 in the mid-1.0800s.
The resumption of the risk aversion on the back of fresh coronavirus jitters is giving extra legs to the buck and the rest of the safe havens, all in detriment of the funding currency.
Later in the session, the greenback is expected to be in centre stage in light of the publication of US inflation figures tracked by the CPI for the month of January. Additional data will see the usual weekly report on the US labour market and the speech by New York Fed’s permanent voter John Williams.
What to look for around EUR
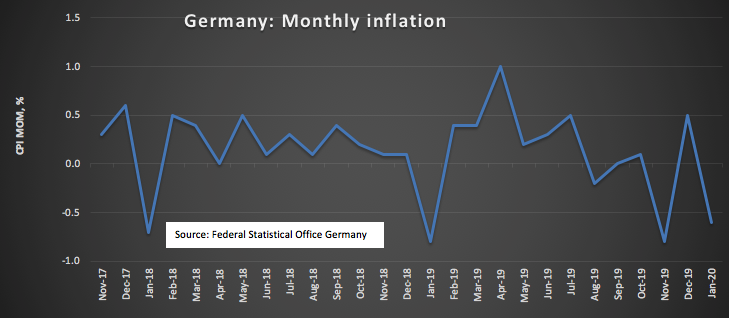
The pair is managing to bounce of YTD lows near 1.0860 region (Wednesday) on the back of an apparent correction lower in the greenback. In the meantime, USD-dynamics are expected to dictate the pair’s price action for the time being along with the broad risk trends, where the COVID-19 is still in the centre of the debate. On another front, the ECB is expected to finish its “strategic review” (announced at its January meeting) by year-end, leaving speculations of any change in the monetary policy before that time pretty flat. Further out, latest results from the German and EMU dockets continue to support the view that any attempt of recovery in the region remains elusive for the time being and is expected to keep weighing on the currency.
EUR/USD levels to watch
At the moment, the pair is retreating 0.16% at 1.0856 and a break below 1.0853 (weekly/2020 low Feb.13) would target 1.0814 (78.6% Fibo of the 2017-2018 rally) en route to 1.0569 (monthly low Apr.10 2017). On the flip side, the next resistance is located at 1.0957 (weekly high Feb.10) seconded by 1.1017 (21-day SMA) and finally 1.1076 (55-day SMA).