GBP/JPY Price Analysis: Recovers from 200-bar SMA, 50% Fibonacci
- GBP/JPY holds onto recovery gains from the short-term key support confluence.
- A two-week-old rising trend line, 61.8% Fibonacci add to the downside barriers.
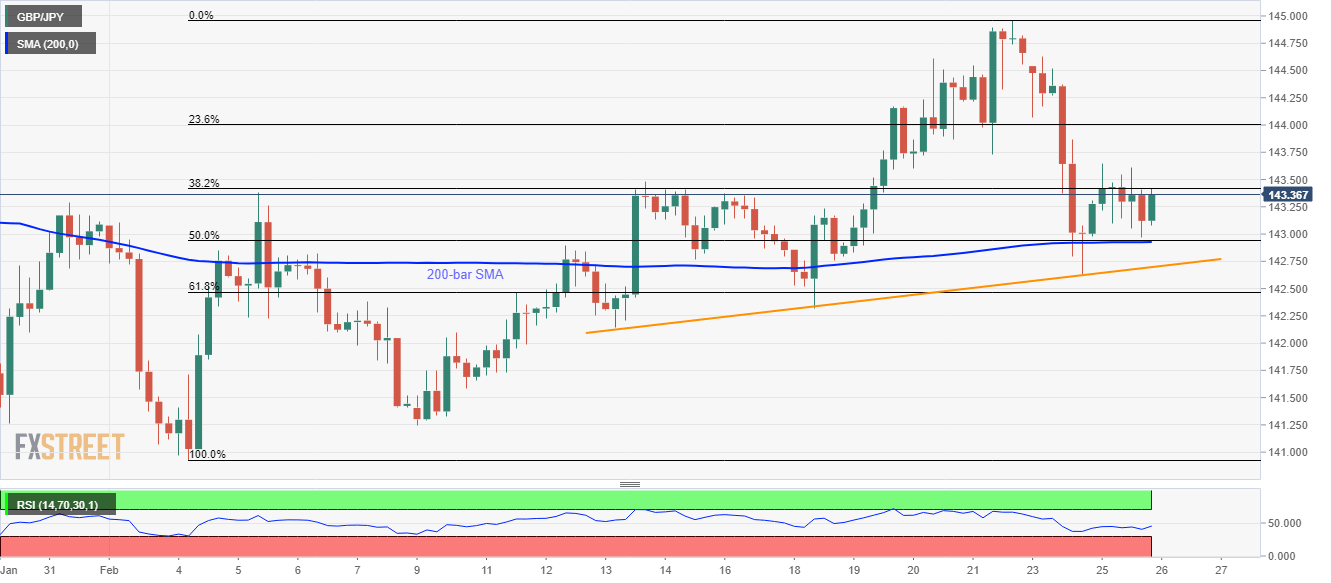
GBP/JPY stays mildly positive while taking the bids to 143.37 during Wednesday’s Asian session. The pair recently bounced off 200-bar SMA and 50% Fibonacci retracement of its current month’s upside.
As a result, buyers are now looking towards the weekly high surrounding 143.70 as an immediate resistance ahead of targeting 23.6% Fibonacci retracement level around 144.00.
Should there be a clear run-up beyond 144.00, the monthly top and an ascending trend line from December 31, 2019, close to 145.00, will be important to watch.
Alternatively, the pair’s declines below 142.95/90 support confluence can take the rest on the short-term support line, at 142.70 prior to challenging the 142.45 support comprising 61.8% Fibonacci retracement.
In a case where the GBP/JPY pair’s prices decline below 142.45, 142.00 and 141.25 can offer intermediate stops before the quote drops to the sub-141.00 area.
GBP/JPY four-hour chart
Trend: Pullback expected